
Summary
The largest sector of the US economy is Services (77.6% of GDP). It’s been this way since ~1967.
The only positive-sum, apolitical way out of the current US government-fueled, inflationary, debt-laden debacle is to increase productivity.
The other ways are increasing taxes and reducing government spending
However, “productivity” is a government statistic that is: laggy, often misunderstood, very complex, and (as I will argue) archaic.
Nascent AI applications, e.g. chatGPT, autoGPT et al, hold tremendous potential, but their connection to “productivity” is opaque at best.
Therefore, don’t bet on AI and Large Language Models (LLM) to turn the US economy around.
The US Economy
The US Service sector is 77.6% of GDP—the largest sector by far. Within the Service sector, there are industries (see chart below). The largest industry is Professional, scientific, and technical services.
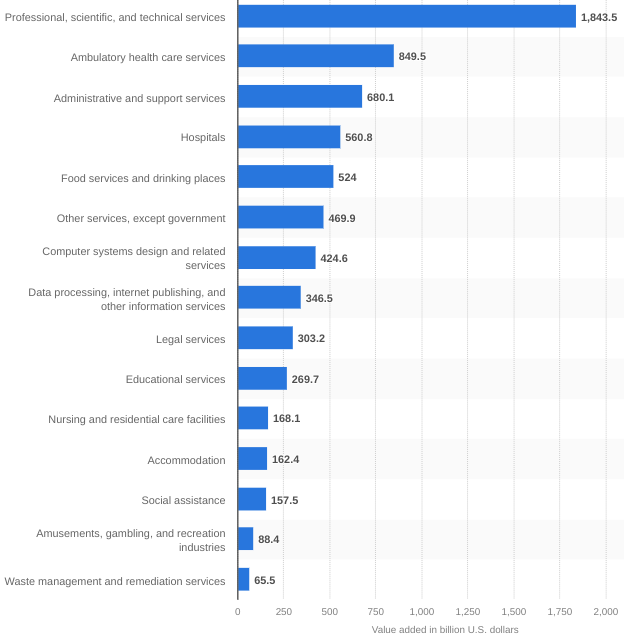
Source: Statistica via BLS & BEA
What does “productivity” actually mean?
Productivity, in economics, measures output per unit of input, such as labor, capital, or any other resource. It is often calculated for the economy as a ratio of gross domestic product (GDP) to hours worked. This is called Labor productivity, and is what most people are referring to when they’re talking about productivity.
Labor productivity is relatively simple to calculate (once the data is captured), as it only requires data on hours worked and output produced. This data is typically available on a regular basis from employers or government agencies, which makes it easier to calculate and report frequently.
That being said, productivity measurement is a complex and nuanced process that requires careful consideration of input and output data, as well as adjustments for various factors such as quality changes, technological advancements, and industry-specific characteristics. ChatGPT is an example of a technological advancement.
What is ChatGPT?
ChatGPT is a chatbot developed by OpenAI. About 100 million people (30% of US; 1.25% of world) signed up in the first two months making it the fastest-growing app in history.
The “GPT” in chatGPT stands for Generative Pre-trained Transformer, which means it can generate helpful responses because it was “trained” on a Large Language Model (LLM), currently in its 4th version (GPT-4). The value to humans, it seems, is to allow us to obtain and automate/act on better information, quicker. Other apps, like Midjourney and DALL-E, allow the user to produce images/video with less work (by typing in what they want to see).
The tech community has embraced chatGPT et al with breathless optimism (and derivative projects, e.g. autoGPT)—which is refreshing considering the dismal spat of technology setbacks and failures of late. In other words, its one of the few positive things to talk about. Many have heralded chatGPT/AI as the next catalyst to drive productivity. Skepticism is warranted.
To understand how/if this technological advancement will impact productivity, we must first understand how productivity works, and then assess how/if/where/when the impact would occur. But before we proceed, let’s take a visual mental break and imagine meditating in a beautiful field. . .

That was nice. Back to productivity.
What about Multi-Factor Productivity (MFP)?
The more sophisticated older sister of labor productivity is Multi-factor Productivity (MFP). MFP takes into account not only labor inputs but also other factors of production such as capital, energy, and materials.
Multi-factor productivity is calculated by dividing output by the combined inputs of labor and capital, energy, and materials. This metric provides a more comprehensive measure of overall efficiency than labor productivity alone, calculated as:
Multifactor Productivity = Output / (Labor Input + Capital Input + Energy Input + Materials Input)Where:
Output is measured in real terms, such as in chained 2012 dollars
Labor Input is measured in hours worked, adjusted for education and experience of the labor force
Capital Input is measured in the quantity of capital, adjusted for quality and depreciation
Energy Input is measured in physical units, such as BTUs or barrels of oil equivalent
Materials Input is measured in physical units, such as tons or cubic meters
The BLS uses a methodology called the Fisher ideal index formula that weights each input according to its share of total production costs in order to combine labor, capital, and intermediate goods into a single unit of production inputs.
The Fisher ideal index formula takes into account the fact that different inputs may have different price changes over time, and therefore weights the inputs based on their relative price changes. This ensures that the index reflects changes in the productivity of all inputs, not just changes in the productivity of the input that happens to have the largest price change.
—> This is critical to understand because new technologies typically have a massively deflationary impact on cost, i.e. it makes stuff a LOT cheaper. Think Netflix vs. cassettes.
I = (Π_i=1^n [(P_i,q_i) / (P_i,0q_i,0)]^(w_i))^(1/Σ_i=1^n w_i)Where:
I = the Fisher ideal index
n = the number of inputs (e.g. labor, capital, intermediate goods)
P_i = the price of input i in the current period
P_i,0 = the price of input i in the base period
q_i = the quantity of input i used in the current period
q_i,0 = the quantity of input i used in the base period
w_i = the cost share weight for input i in the base period
Given this added complexity, MFP data is typically released less frequently than labor productivity data. For example, the BLS publishes MFP data for the nonfarm business sector every five years, whereas labor productivity data is released on a quarterly and annual basis.
It's worth noting that productivity measures have some limitations and can be subject to measurement error. For example, productivity measures may not fully capture the value of intangible assets such as intellectual property or organizational capital, which can be important drivers of economic growth. Additionally, productivity measures can be affected by changes in the composition of the labor force, shifts in industry structure, and other factors outside of the control of individual firms.
Why productivity is an archaic statistic
In addition to these productivity metrics being 3-24 months stale, let’s not forget that the primary input for productivity is hours worked. This is a dangerously blunt way to cut through the output of our collective citizenry.
Why? Because AI agents will, in 1-3 years, be doing more and more work. The risk here is the growing “shadow AI labor force” isn’t accounted for in government statistics and will create output falsely attributed to human hours—further increasing human leisure time and digital addiction (a topic for another blog post).
Will chatGPT/AI boost US productivity?
Let’s ask ChatGPT for fun:
As an AI language model, ChatGPT itself is unlikely to directly affect US productivity. However, the technology underlying ChatGPT, along with other forms of AI and automation, has the potential to improve productivity in a number of ways.
For example, AI and automation can help automate routine and repetitive tasks, freeing up workers to focus on higher-value activities that require more creativity, problem-solving skills, and social intelligence. AI can also help optimize processes and operations, identify inefficiencies and bottlenecks, and enable faster and more accurate decision-making.
In addition, ChatGPT and other AI technologies can enable more personalized and targeted communication and education, which can help workers develop the skills and knowledge they need to be more productive in their jobs. By providing customized learning experiences that are tailored to individual needs and preferences, AI can help workers acquire new skills more quickly and effectively.
Overall, the impact of ChatGPT technology on US productivity will depend on a variety of factors, including the pace of technological development, the extent to which workers are able to adapt and learn new skills, and the effectiveness of policies and institutions in facilitating the adoption and diffusion of new technologies.
This is a decent answer. Thank you, ChatGPT. Let’s try to connect the AI value props (above, in bold) to specific productivity line items.
The next release after that would be for the first quarter of 2023 (January to March), which is scheduled for June 2, 2023.
Initial release of First Quarter 2023 data: May 4, 2023
Revision of First Quarter 2023 data: June 1, 2023
Initial release of Second Quarter 2023 data: August 3, 2023
Revision of Second Quarter 2023 data: September 7, 2023
There are a number of risks to the US economy that receive less attention in the media but could still have significant impacts. Here are a few examples:
Cybersecurity threats: With the increasing reliance on technology and digital infrastructure in many sectors, cyber attacks have the potential to disrupt businesses, government operations, and financial markets. These attacks could result in significant financial losses, damage to critical infrastructure, and erosion of public trust.
Climate change: The physical and economic impacts of climate change, such as extreme weather events, rising sea levels, and food and water shortages, could have major effects on the US economy. In addition to the direct costs of these impacts, efforts to mitigate and adapt to climate change could require significant investments and changes to current practices.
Demographic changes: The aging of the US population and changing demographics could have far-reaching economic impacts. For example, a shrinking workforce could lead to labor shortages and slower economic growth, while changes in consumer behavior could alter demand for certain products and services.
Geopolitical risks: Tensions between major global powers, such as the US and China, could lead to increased trade barriers, supply chain disruptions, and other economic disruptions. Conflicts or political instability in other regions of the world could also have ripple effects on the US economy.
Income inequality: Rising income inequality could lead to decreased social mobility, political instability, and lower economic growth. It could also lead to reduced consumer demand, as low- and middle-income households have less disposable income to spend.